正常な場合
ダメな場合
(ここは授業中に説明します)
\sectionコマンド)
\end{document}
hints.pdf を見る。
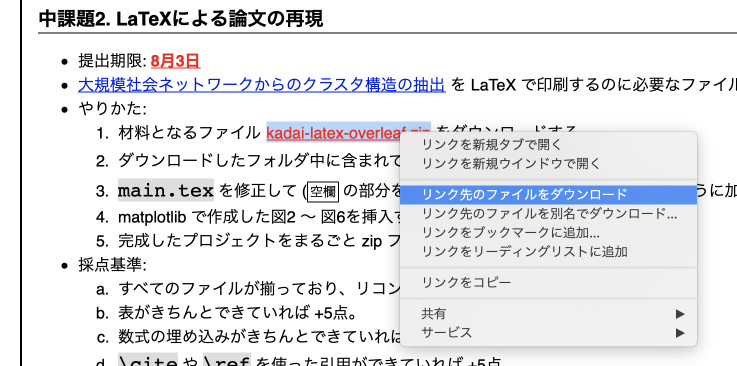
main.tex を修正して (空欄 の部分を埋める)、
goal.pdf と同じになるように加筆する。
\cite や \ref を使った引用ができていれば +5点。
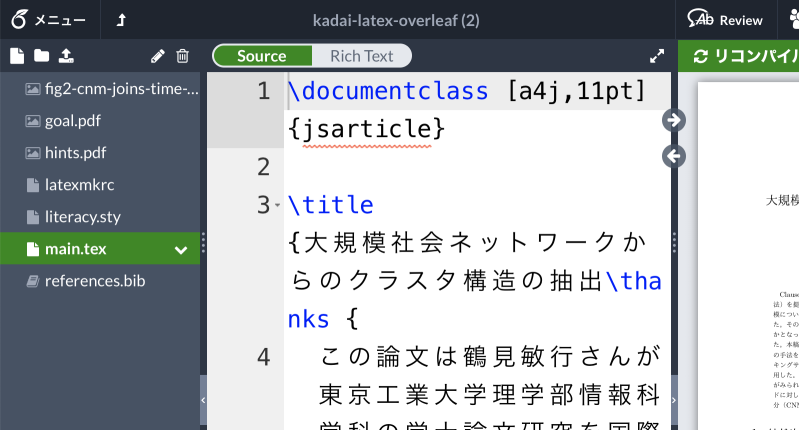
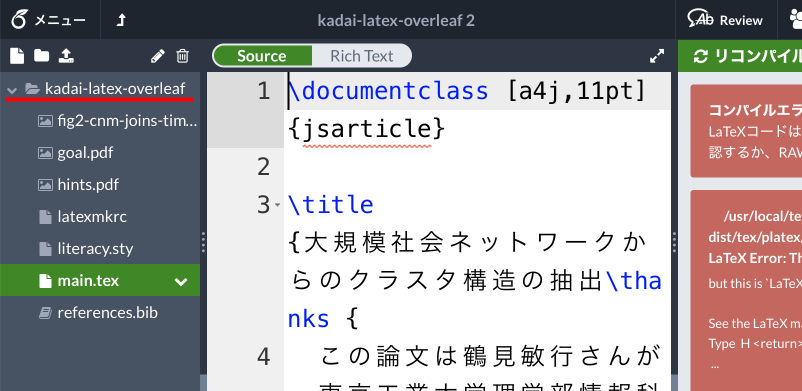
Mac を使っていて Overleaf でうまくコンパイルできない場合は、 以下のことを試してみる:
ダメな場合
\begin{tabular} 〜 \end{tabular} を使う:
\begin{center}
\begin{tabular}{lrr}
品名 & 値段 & 数量 \\
チョコレート & 10 & 300 \\
クッキー & 150 & 20 \\
アイスクリーム & 200 & 4 \\
\end{tabular}
\end{center}
\begin{tabular}{lrr}
l…左寄せ, r…右寄せ, c…中央寄せ。
\begin{tabular}{|l|r|r|}
\hline
| City | Highest ℃ | Lowest ℃ |
| Tokyo | 31 | 1 |
| Honolulu | 32 | 19 |
| Yakutsk | 26 | -42 |
.texの最初の部分:
\documentclass[a4j,11pt]{jarticle}
\usepackage[dvipdfmx]{graphicx}
\begin{document}
\begin{center}
\begin{tabular}
...
図 \ref{fig:neuman time diff} を参照せよ。
これが、こうなる:
\begin{figure}
\begin{center}
\includegraphics[width=0.80\linewidth]
    {fig2-cnm-joins-time-series.pdf}
\caption{ネットワークの解析に要した時間の時系列遷移}
\label{fig:neuman time diff}
\end{center}
\end{figure}
図 \ref{fig:neuman time diff} を参照せよ。
\begin{table}
\begin{center}
\begin{tabular}{lrr}
...
\end{tabular}
\end{center}
\caption{各都市の気温}
\label{tbl:temp}
\end{table}
\section{節の名前}
\label{sect:nanka}
...
各都市の気温」、
およびラベル tbl:temp をつけよ:
\begin{table}
...
\caption{各都市の気温}
\label{tbl:temp}
\end{table}
fig:temp というラベルをつけよ。
\caption{各都市の気温}
\label{fig:temp}
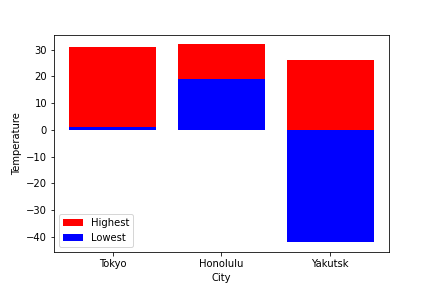
棒グラフを描画するには以下のようにする:
import numpy as np
import matplotlib.pyplot as plt

plt.bar(['Tokyo','Honolulu','Yakutsk'], [31,32,26], label="Highest", color="red")
plt.bar(['Tokyo','Honolulu','Yakutsk'], [1,19,-42], label="Lowest", color="blue")

plt.xlabel("City")
plt.ylabel("Temperature")
plt.legend()
plt.savefig("./temp.png")
plt.show()
表 \ref{tbl:temp} および
図 \ref{fig:temp} を参照のこと。
表 1 および図 1 を参照のこと。
\cite{kumar-1999-trawling-the-web-for-
emerging-cyber-communities}
は特によく知られている。
これが、こうなる:
references.bib ファイルに記載されているので、
このファイルを .tex と同じフォルダに置いておけば自動的に利用される。
Zoom の Breakout Room 機能を使って、 各グループに分かれて作業する練習をおこなう。
.texファイルを OCW-i から提出せよ。
ここには「各都市の気温」表と棒グラフの図がどちらも含まれており、
各図表に正しい番号がふられていること。
(なお、提出するのは .texファイルのみでよい)